Population Impact
How many people the weather is actually affecting — mapped from a 1-kilometer population grid onto the NOAA/NWS forecast. Every figure below counts real people under a live alert or a forecast threshold across the Lower 48.
CONUS POPULATION
—
2026 estimate · lower-48
UNDER ACTIVE ALERTS
—
mapped NWS alert areas
HIGH ≥ 90°F TODAY
—
forecast heat exposure
7-Day Exposure Card
SHAREABLE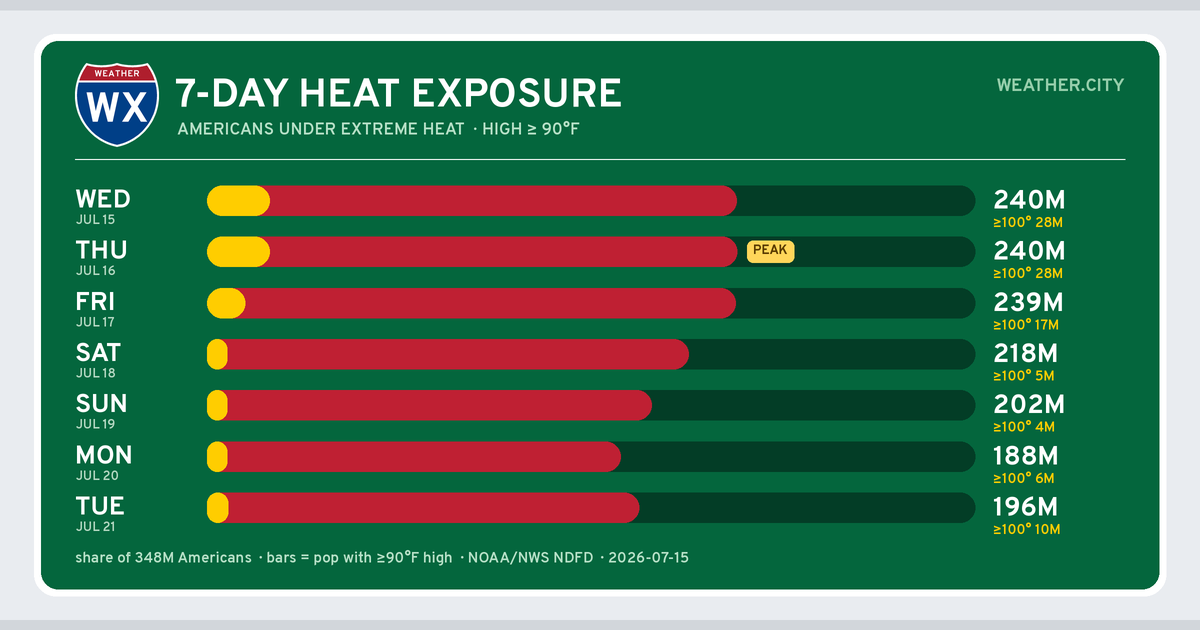
The Average American
7-Day Peak Exposure
EACH PERSON'S HOTTEST DAY THIS WEEKLoading…
Temperature Exposure
By State — Today
SORT ANY COLUMNAvg High and Avg Low are population-weighted — the temperature the average resident of that state experiences (big metros count more than empty land). Exposure columns count residents whose forecast high crosses the threshold.